Marketing and data analytics: A Practical Guide to E-commerce Growth
Marketing and data analytics is simply the practice of measuring, managing, and analysing your marketing performance to get better results. Think of it as the compass and charts for your business—it turns the raw numbers from your campaigns into a clear roadmap for growth. This process transforms guesswork into predictable, profitable decisions.
How Marketing and Data Analytics Drive E-Commerce Growth

Imagine trying to navigate a ship in a storm without any instruments. That’s what running a modern e-commerce brand feels like when you’re not using your data properly. You have information pouring in from all directions—Shopify, Google Ads, Meta, Klaviyo—but it often creates a fog of disconnected numbers rather than a clear path forward.
This data chaos is a huge headache for most direct-to-consumer (DTC) brands. Vital information lives in separate silos, making it nearly impossible to see the complete picture. You might know your ad spend on one platform and your sales on another, but connecting the two to understand true profitability remains a constant struggle.
From Data Overload to Strategic Clarity
The solution isn’t more data; it’s unified data. By bringing together information from all your different sources, you can finally start answering the critical questions that drive sustainable growth. This is the whole point of combining marketing and data analytics.
A unified approach helps you achieve a few key things:
- Optimise Ad Spend: Understand which campaigns are actually delivering a positive Return on Ad Spend (ROAS) and which are just burning cash.
- Understand Customer Behaviour: See the entire journey, from the first ad they clicked to their final purchase and beyond.
- Improve Profitability: Make informed decisions about pricing, promotions, and inventory based on what the numbers are actually telling you.
The foundation for big gains in e-commerce often comes from adopting robust data-driven e-commerce strategies. It’s really about building a system that reliably turns raw data into profitable actions.
Fuelling Growth in a Competitive Market
This focus on data isn’t just a trend; it’s a fundamental shift in how successful businesses operate. The UK data analytics market is projected to hit USD 25.3 billion by 2033, growing at a compound annual rate of 19.67%. Retailers that use analytics to really understand their customers are gaining a massive competitive edge.
By setting up a clear analytics framework, you move from just reacting to last month’s reports to proactively shaping your brand’s future. This guide will walk you through the practical journey—from wrestling with messy spreadsheets to making confident, growth-focused decisions.
Moving from Reactive Reports to Proactive Insights
For years, the standard for measuring performance was a stale monthly report. These static PDFs would land in your inbox long after the period ended, offering a backward-looking glimpse at what had already happened. While useful for historical record-keeping, this reactive approach leaves growth teams constantly playing catch-up.
The real competitive advantage today comes from flipping the script. Stop asking, “what happened?” and start asking, “why did it happen, and what should we do next?” This means moving beyond historical snapshots and embracing continuous, real-time monitoring.
This fundamental shift is where modern marketing and data analytics creates immense value. It’s the difference between reading an old map and having a live GPS that reroutes you around a traffic jam before you even get stuck.
The Tangible Benefits of a Proactive Stance
For e-commerce and DTC brands, this transition isn’t just about convenience; it directly hits the bottom line. When your team can see and understand performance changes as they occur, you unlock some seriously powerful advantages.
- Smarter Ad Spend Allocation: Quickly spot underperforming campaigns and shift your budget to the channels and creatives delivering the best returns right now, not last month.
- Increased Customer Lifetime Value (CLV): Identify positive trends in customer behaviour or successful upselling tactics, letting you double down on what works to nurture long-term loyalty.
- Crucial Early Warnings: Get ahead of problems before they spiral. A proactive system can flag a sudden drop in conversion rates or warn you about low inventory on a best-selling product, giving you time to react.
This shift towards proactive strategy is gaining serious momentum. A recent survey of UK marketing leaders found that over two-thirds now use analytics data more proactively for planning, a dramatic increase from just 27% the previous year. You can explore the full findings on the state of marketing analytics from Mediahawk to see how quickly the industry is evolving.
Introducing the Always-On Analyst
To truly get from reactive reporting to proactive insights, you have to understand how different channels contribute to conversions—a puzzle solved by understanding attribution modeling. But trying to connect all those dots manually is a monumental task. This is where the concept of an ‘always-on analyst’ comes in.
Imagine a system working tirelessly in the background, 24/7. It plugs into all your disparate data sources—from Shopify and Google Analytics to your ad platforms and spreadsheets—and constantly monitors your most important metrics.
This automated analyst doesn’t just show you data; it interprets it. When a key metric deviates from the norm or crosses a critical threshold you’ve set, it automatically alerts your team. It explains what changed and provides the context needed to make a fast, informed decision.
This frees up your team from the manual grind of pulling data and building reports, allowing them to focus entirely on strategy and execution. This is the future of marketing analytics—turning your data ecosystem into an intelligent partner that helps you act before small issues become major problems.
Connecting Core Metrics to Your Business Health
To get real value from your data, you have to focus on what actually moves the needle. It’s easy to get distracted by vanity metrics like social media likes—they look great in a report, but they don’t pay the bills. The trick is to tie every marketing action directly to the financial health of your business by tracking a handful of core key performance indicators (KPIs).
Think of these KPIs as a regular health check for your brand. They don’t just tell you what happened; they help you diagnose why. By grouping them into three core buckets—Customer Acquisition, Customer Behaviour, and Customer Retention—you get a clear, actionable picture of your entire business.
Customer Acquisition: What Does It Cost to Get a Customer?
This is the first, most fundamental question: how much are you paying to bring someone new through the door? If you don’t have a firm grip on this number, you’re flying blind. You can’t possibly know if your marketing is actually profitable. These metrics are the foundation of any sustainable growth plan.
The two metrics that matter most here are:
- Customer Acquisition Cost (CAC): This is your total marketing and sales spend divided by the number of new customers you brought in over a set period. It gives you the big-picture view of what it costs to win a customer.
- Cost Per Acquisition (CPA): This one is more granular, usually tracked at the campaign or channel level. It measures the cost to get a specific action, like a lead, a sign-up, or that all-important first purchase.
A high CAC isn’t automatically a red flag, especially if your customers stick around and spend a lot over time. But a rising CAC? That’s an early warning sign. It could mean your ad performance is slipping or you’re starting to saturate your target market. The raw data for these numbers comes straight from your ad platforms, like Google Ads and Meta Ads.
Customer Behaviour: What Happens When They Get to Your Site?
Once you’ve paid to get someone to your website, the game shifts from acquisition to conversion. This next set of metrics tells you how good your site and products are at turning visitors into buyers. They shine a light on friction points in the customer journey and show you where to focus your optimisation efforts.
A few key behaviour metrics to watch:
- Conversion Rate (CR): The percentage of visitors who take the action you want them to, which for most e-commerce brands is making a purchase. A low conversion rate can point to problems with your site’s user experience, your pricing, or how you’re communicating your product’s value.
- Average Order Value (AOV): Simply put, the average amount customers spend each time they check out. Pushing this number up with tactics like product bundles or smart upsells is one of the fastest ways to grow revenue without needing to find more traffic.
You’ll find these numbers living inside your main e-commerce and web analytics platforms. Shopify (or whichever platform you use) holds all the transactional data for AOV, while Google Analytics 4 is where you’ll go to understand conversion rates and how people are moving through your site.
Tracking these metrics is step one, but the real goal is connecting them to profitability. A critical part of this process involves understanding your return on investment. To dig deeper, you can explore our detailed guide on how to measure marketing ROI for practical frameworks.
Customer Retention: Are Your Customers Sticking Around?
Getting a new customer is expensive. Keeping an existing one is where you make your money. Retention metrics are arguably the most important signal of your brand’s long-term health. They measure your ability to build a loyal customer base that drives predictable, recurring revenue. Strong retention is what separates the high-growth brands from the ones constantly burning cash just to stay afloat.
The two retention metrics you can’t ignore are:
- Customer Lifetime Value (LTV): This metric forecasts the total amount of revenue you can expect from a single customer over their entire relationship with you. A high LTV means you have happy customers who keep coming back for more.
- Churn Rate: The percentage of customers who stop buying from you over a given time. High churn is a massive red flag, signalling potential issues with your product, customer service, or the overall brand experience.
To track these properly, you need to connect the dots between your sales platform (like Shopify) and your customer communication tools (like Klaviyo) to build a complete view of the customer lifecycle. By zeroing in on these core metrics across acquisition, behaviour, and retention, you create a powerful diagnostic tool for your business.
To pull all this together, it helps to map out exactly where each piece of data comes from. Think of it as creating a schematic of your data ecosystem.
Table: Essential E-Commerce Metrics and Their Data Sources
| Metric Category | Key Metric | What It Measures | Primary Data Source(s) |
|---|---|---|---|
| Customer Acquisition | Customer Acquisition Cost (CAC) | The total cost to acquire a single new customer. | Ad Platforms (Meta, Google), CRM, Financial Software |
| Customer Acquisition | Cost Per Acquisition (CPA) | The cost for a specific action (e.g., purchase, lead). | Ad Platforms (Meta, Google, TikTok) |
| Customer Behaviour | Conversion Rate (CR) | The percentage of site visitors who make a purchase. | Web Analytics (Google Analytics 4), E-commerce Platform |
| Customer Behaviour | Average Order Value (AOV) | The average amount spent per order. | E-commerce Platform (Shopify, BigCommerce) |
| Customer Retention | Customer Lifetime Value (LTV) | The total predicted revenue from a customer over time. | E-commerce Platform, Subscription Platform, CRM |
| Customer Retention | Churn Rate | The percentage of customers lost in a given period. | E-commerce Platform, Subscription Platform (Recharge) |
| Customer Retention | Repeat Purchase Rate | The percentage of customers who have made >1 purchase. | E-commerce Platform, ESP (Klaviyo) |
This table isn’t just a list; it’s a practical roadmap. It shows you that a holistic view of performance requires pulling information from several different places. The real power comes not just from tracking these metrics in isolation, but from understanding how they influence each other. That’s when data stops being a report and starts being a growth engine.
Building Your Data-Driven Marketing Workflow
Turning raw data into profitable decisions isn’t about just tracking the right metrics; it’s about building a structured, repeatable workflow. Without a clear process, teams inevitably slide back into the familiar chaos of messy spreadsheets and confusing dashboards, where data gets collected but rarely leads to decisive action. The whole point is to build a system where insights flow logically from your tools to your team, and finally, into your strategy.
This workflow is the bridge connecting your data sources to your business outcomes. It ensures everyone, from the CMO needing a high-level view to the performance marketer digging into daily numbers, can access and understand the information they need. It’s about creating a single source of truth that powers smarter, faster decisions across the entire business.
Assembling Your Modern Analytics Stack
A modern analytics stack is simply the set of tools you use to collect, process, and visualise your data. Think of it as a factory assembly line for insights. Each component has a specific job, and when they’re connected properly, the output is a clear, actionable understanding of what’s happening in your business.
A typical e-commerce stack has a few key layers:
- Data Integration Tools: These are the connectors. They pull raw data from all your different platforms—like Shopify, Google Ads, Meta, and Klaviyo—into one central place. This is the crucial first step to breaking down data silos.
- Analysis and Querying Tools: Once your data is all in one place, you need a way to ask questions. This is where tools that can query your database come in, letting you slice and dice the information to find trends and patterns.
- Visualisation and Reporting Tools: This is the final layer, where raw numbers become charts, graphs, and dashboards. The goal here is to make complex data dead simple for anyone on the team to understand at a glance.
The best workflow isn’t about having the most expensive or complicated tools. It’s about having the right tools connected in a way that kills manual work and gets insights directly to the people who need them.
A Practical Workflow for a DTC Brand
Let’s walk through a real-world scenario. Imagine a DTC brand that sells sustainable home goods suddenly sees a 15% drop in daily sales. Panic mode. Without an integrated workflow, the team would be scrambling—pulling separate reports from Shopify, Google Analytics, and their ad platforms, trying to stitch together a story from conflicting spreadsheets.
With a proper data workflow, the process is completely different.
The flow diagram below shows the key stages of the customer journey, from acquisition to retention, that a unified workflow helps you analyse.
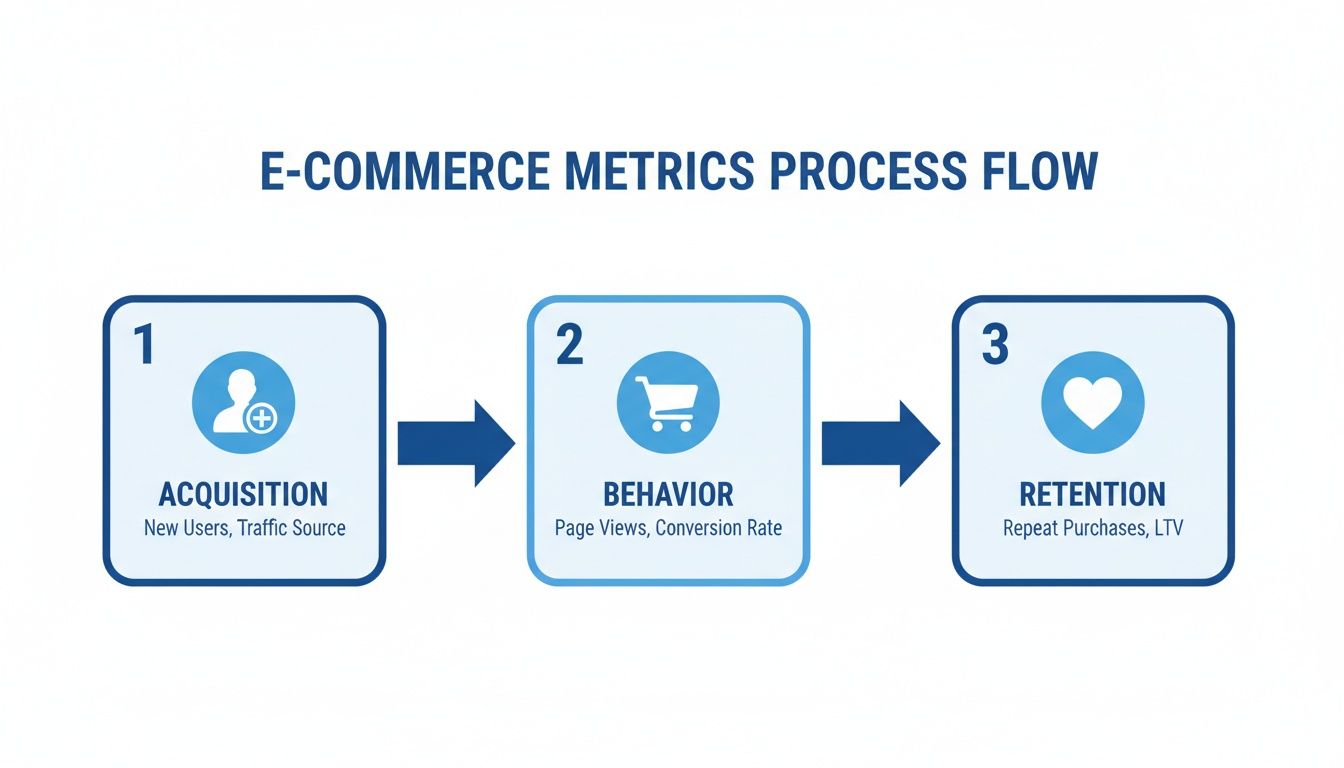
This visual really drives home how interconnected each stage is. A problem in one area, like acquisition, will almost certainly cause problems downstream in behaviour and retention.
Here’s how the team would investigate that sales drop using their integrated system:
- Start with the High-Level Question: The CMO asks the system, “Why did our sales drop yesterday?” Because all data sources are connected, the system can immediately cross-reference sales data from Shopify with website traffic from Google Analytics.
- Drill Down to the Source: The system shows that overall website traffic was stable, but the conversion rate fell off a cliff. This immediately rules out an advertising problem and points to an issue on the website itself.
- Segment to Find the “Why”: The marketing manager then asks, “Compare conversion rates yesterday by traffic source and device.” The analysis reveals the drop was isolated to mobile users coming from Meta ads.
- Pinpoint the Root Cause: Finally, by looking at visitor behaviour for that specific group, they find a broken “Add to Cart” button on their main landing page, but only on mobile browsers.
This entire investigation, which could have taken days of manual data-pulling, is done in minutes. The team can fix the bug, get the conversion rate back up, and stop the bleeding. This is the power of a workflow that lets you move seamlessly from a high-level business problem to a specific, actionable insight. It also highlights why looking at different groups of customers is so important. To learn more, check out our guide on what is customer segmentation for a deeper dive.
How Top Brands Use Marketing Analytics to Win
Theory is one thing, but seeing marketing analytics in action is what really makes the lightbulb go on. The best brands don’t just collect data; they use it to answer tough business questions and make decisions that directly impact their bottom line. It’s all about turning numbers into a narrative that guides your next move.
Let’s walk through a few real-world examples that show how e-commerce and DTC businesses use this approach to solve common, high-stakes problems. These aren’t just hypotheticals—they’re blueprints for how to win in a crowded market.
Case Study 1: Optimising Ad Spend with ROAS Analysis
A fast-growing DTC skincare brand was scaling its advertising aggressively across Meta and Google. While top-line revenue was climbing, profit margins were getting squeezed. The core business question was simple but critical: “Which of our ad channels are actually profitable, and where should we reallocate our budget?”
The team integrated their ad platform data from Meta and Google Ads with their sales data from Shopify. This let them move beyond platform-specific metrics and analyse their blended Return on Ad Spend (ROAS) and, more importantly, their Marketing Efficiency Ratio (MER).
The insight was immediate and stark. While a specific Google Shopping campaign had a high click-through rate, its ROAS was barely breaking even. In contrast, a Meta retargeting campaign, though smaller in scale, was delivering a 4.5x ROAS. Armed with this clarity, they shifted £20,000 of their monthly budget from the underperforming Google campaign to the high-performing Meta one. The tangible outcome? A 32% increase in overall profitability within a single quarter, all without increasing their total ad spend.
Case Study 2: Boosting LTV Through Customer Segmentation
An online pet supply store noticed a lot of one-time buyers. They needed to figure out how to encourage repeat purchases and increase Customer Lifetime Value (LTV). Their key question was: “Which of our customers are most likely to buy again, and what do they buy?”
By connecting their Shopify order data with their Klaviyo email platform, they started segmenting their customer base. You can learn more about the power of this approach by exploring how brands are analysing Shopify orders at scale to find hidden growth opportunities. They created segments based on initial purchase category—think “first-time puppy food buyers” versus “durable toy buyers.”
This analysis revealed that customers who bought puppy food were 75% more likely to make a second purchase within 60 days. The team used this insight to build a personalised email automation. Now, new puppy food buyers receive a targeted follow-up campaign with related products like training treats and developmental toys. This single, data-informed change led to a 22% increase in their 90-day LTV.
This highlights how analytics-fuelled marketing is a powerhouse for economic impact. In fact, Data-Driven Companies (DDCs) in the UK generate an estimated £343 billion in annual turnover, with AdTech DDCs contributing £194 billion of that through data analytics and AI-powered marketing. Discover more insights about the UK data analytics market on grandviewresearch.com.
Case Study 3: Preventing Stockouts with Predictive Analytics
A popular fashion retailer faced a recurring nightmare: their best-selling items would sell out during peak shopping seasons, leading to lost sales and unhappy customers. Their operations team needed to answer: “How can we accurately forecast demand to prevent stockouts of our key products?”
They integrated historical sales data from their e-commerce platform with their inventory management system. Using this combined dataset, they built a simple predictive model that analysed sales velocity and seasonality for their top 20 products. The model flagged which items were projected to sell out based on current trends.
This insight allowed the operations team to proactively place larger purchase orders weeks ahead of the holiday rush. The result was a 90% reduction in stockouts on their best-sellers during their busiest quarter, capturing an estimated £150,000 in previously lost revenue. Each of these cases shows how the right approach can unlock powerful results, often without needing a massive data science team.
The Future of Analytics Is an AI-Powered Analyst

The world of marketing and data analytics has come a long way. Not too long ago, we were all stuck in spreadsheets, a slow and painfully error-prone process. Then came the era of complex Business Intelligence (BI) dashboards. They looked impressive, but often left teams with more charts than clear answers, requiring a data expert to translate them into something useful.
Now, we’re stepping into a completely new phase, one defined by the AI-powered analyst. This is a massive leap forward. We’re moving beyond static reports and into the world of conversational intelligence. Forget trying to decipher a dozen charts—now you can just ask your business questions in plain English and get trusted answers, instantly.
For non-technical founders, marketers, and operators who need to make smart decisions without writing a single line of code, this changes everything.
From Dashboards to Decisions
Here’s the fundamental difference: a traditional dashboard shows you what happened. An AI analyst tells you why it happened.
Think of it like having an expert on your team who is connected to all your data sources in real-time. They’re always on, ready to investigate any performance question you throw at them. This new way of working delivers three huge benefits that directly boost your team’s agility and your bottom line:
- Lightning-Fast Insights: You get answers in seconds, not hours or days. That speed means your team can react to market shifts and jump on opportunities the moment they appear.
- Proactive Problem-Solving: An always-on analyst monitors your key metrics 24/7. It automatically flags significant changes—like a sudden drop in conversion rate—so you can fix problems before they become expensive ones.
- Democratised Data Access: Suddenly, everyone on the team can self-serve their own insights without needing to wait for a data expert. This is how you build a culture of data-backed decision-making from the ground up.
The real goal of marketing analytics isn’t just to collect data; it’s to turn that data into a decisive competitive advantage. An AI analyst makes this a reality by making sophisticated analysis accessible to everyone.
For example, take a look at how an AI analyst like Menza surfaces clear, proactive alerts that anyone on the team can understand and act on.
This screenshot shows exactly what I mean. An automated alert has clearly identified a performance issue—a drop in ROAS for a specific campaign—and provides all the context needed to make a quick decision. It closes the gap between seeing data and taking action, empowering your team to drive much better results.
Frequently Asked Questions
Jumping into marketing and data analytics can feel like a lot when you’re busy running a business. We get it. Here are some straight answers to the questions we hear most often from e-commerce leaders.
Where Should a Small E-commerce Business Start with Analytics?
Don’t try to boil the ocean. The best place to start is by picking one core business goal—like increasing online sales—and working backwards from there.
First, connect your most important data sources, which are usually Google Analytics 4 and your e-commerce platform like Shopify. Then, focus on just a handful of metrics that directly impact that goal. Think conversion rate, customer acquisition cost (CAC), and average order value (AOV). The point isn’t to track everything at once, but to get a really deep understanding of the numbers that actually move the needle.
How Is an AI Analyst Different from a Traditional Dashboard?
A traditional dashboard is like a car’s rear-view mirror. It’s a static map showing you pre-set charts about what has already happened. It’s a decent historical record, but it can’t tell you why something changed or what turn to take next.
An AI analyst, on the other hand, is like having an expert navigator sitting right next to you. You can ask it questions in plain English to uncover the real story behind the numbers. It also works proactively, keeping an eye on your key metrics 24/7 and sending you alerts about important shifts you might have otherwise missed. It closes the gap between just seeing the data and actually making a decision.
“Your job will not be taken by AI. It will be taken by a person who knows how to use AI.”
This gets to the heart of it: tools like an AI analyst empower your team. They make people more effective and strategic, rather than replacing them.
What Are the Biggest Mistakes to Avoid in Data Analytics?
Even the most well-intentioned data strategies can get derailed by a few common pitfalls. The first is tracking ‘vanity metrics’—like social media likes instead of actual sales—that look impressive but have zero connection to your bottom line.
The second big mistake is looking at data in separate silos. When your ad data from Meta and your sales data from Shopify don’t talk to each other, you can never get a true picture of profitability. Finally, many teams get stuck in ‘analysis paralysis,’ becoming so overwhelmed by all the data that they just fail to act.
The fix? Start with clear business questions, integrate your key data sources from the beginning, and pick tools that give you real insights, not just more charts to stare at.
Ready to stop wrestling with dashboards and start getting clear answers from your data? With Menza, you get an always-on, AI-powered analyst that connects to your entire stack, monitors performance 24/7, and answers your toughest business questions in plain English. Transform your data into your biggest advantage today.
Stop guessing. Start knowing.
Menza connects to your Shopify, Klaviyo, ad platforms, and 650+ other data sources. Ask questions in plain English and get answers you can trust — no spreadsheets, no code, no waiting.