How to Calculate ROAS A Practical UK Business Guide
Let’s get straight to it. Return on Ad Spend (ROAS) tells you exactly how much money you’re making for every pound you put into advertising. The formula is beautifully simple: Revenue from Ads ÷ Cost of Ads. This one number cuts through the noise and shows you if your campaigns are actually working.
What ROAS Is and Why It’s a Game-Changer for UK Brands
Getting your head around ROAS isn’t just some academic task; it’s essential for any UK brand that wants to grow profitably. It’s the clearest signal you have for whether your ad budget is fuelling growth or just a leaky bucket draining your bank account. If you don’t know this number, you’re flying blind.
Think about it this way: say you run a coffee subscription box out of Bristol. You spend £2,000 on a Meta Ads campaign. That campaign brings in £8,000 in new subscription revenue. Your ROAS is 4 (£8,000 ÷ £2,000). For every £1 you spent, you got £4 back. Simple. That tells you instantly that the campaign was a winner and probably worth scaling up.
ROAS vs Other Key Marketing Metrics
It’s really easy to mix up ROAS with other marketing acronyms, especially Return on Investment (ROI). They sound similar, but they measure completely different things and answer different questions. ROAS is a tactical metric, laser-focused on the effectiveness of your advertising. ROI is strategic, looking at the overall profitability of an entire business effort.
ROAS is all about the top-line revenue generated by a specific ad campaign. In contrast, ROI digs deeper to calculate the net profit from an entire investment, accounting for everything from ad spend and product costs to shipping and staff time.
This distinction is critical. A campaign can have a fantastic ROAS but still lose you money once all your other business costs are factored in. That’s why you need to track both to get a true picture of your financial health.
To make this crystal clear, here’s a quick breakdown of how ROAS compares to other common metrics you’re probably looking at.
ROAS vs Other Key Marketing Metrics
This table should help clear up any confusion and show you what each metric is really for. They all have their place, but they aren’t interchangeable.
| Metric | What It Measures | Primary Use Case | Formula |
|---|---|---|---|
| ROAS | Gross revenue generated per pound of ad spend. | Assessing the efficiency of specific ad campaigns. | Ad Revenue / Ad Cost |
| ROI | Total net profit from an investment. | Evaluating the overall profitability of a business initiative. | (Net Profit / Total Cost) x 100 |
| CPA | The cost to acquire a single paying customer. | Understanding the cost-effectiveness of customer acquisition. | Total Ad Spend / Number of Conversions |
| CVR | The percentage of ad clicks that result in a conversion. | Measuring how well ads and landing pages persuade users. | (Conversions / Clicks) x 100 |
As you can see, ROAS is purely about the relationship between ad spend and the revenue it generates. CPA (Cost Per Acquisition) tells you how much you paid for a customer, and CVR (Conversion Rate) tells you how good your ads are at getting people to take action. They all work together, but ROAS is the one that connects spend directly to income.
Getting to Grips with the Core ROAS Calculation
Okay, so you know the basic formula. But theory is one thing; putting it into practice with real numbers is where the clarity really comes from. This is how you go from just knowing a definition to actually making smart decisions about where your ad budget is going.
Let’s walk through a tangible example. Imagine you’re running a skincare brand out of Manchester. You’ve just launched a new serum and you’ve put some money behind a Meta Ads campaign to get it off the ground.
Here are the numbers:
- You spent £1,500 on that campaign over the course of a month.
- By tracking sales that came directly from those ads, you can see it brought in £7,500 in revenue.
Using that core formula we talked about, the maths is pretty simple:
£7,500 (Revenue from Ads) / £1,500 (Cost of Ads) = 5
That gives you a ROAS of 5. Or, to put it another way, for every £1 you tipped into that Meta campaign, you got £5 back in sales. That’s a strong signal. It tells you the creative, the targeting, and the product itself are all hitting the right notes with your audience. If you want to see a few more worked examples, there’s a comprehensive guide on how to calculate Return on Ad Spend that breaks it down further.
Making It Work in Your Spreadsheets
Obviously, you’re not going to be doing this on a calculator every day. You can get Google Sheets or Excel to handle this for you pretty easily. Let’s say your revenue for a campaign is in cell A2 and the ad spend is in cell B2. The formula is just:
=A2/B2
That spits out your raw ROAS number. If you’d rather see it as a percentage, you can use =(A2/B2)*100. Simple.
The single biggest mistake you can make when calculating ROAS is using incomplete or inaccurate data. Your calculation is only as reliable as the numbers you feed into it.
This is critical. You have to be honest about what you include in your ‘Cost of Ads’. It’s almost never just the direct platform spend. For a true picture, you need to be factoring in the other stuff, too:
- Creative Costs: Did you pay a designer or a videographer to make the ads? That’s a cost.
- Agency or Freelancer Fees: Are you paying someone to manage your campaigns for you? That counts.
- Tool Subscriptions: Using any special software for ad management or optimisation? Add it to the pile.
Including these associated costs gives you a much more sober, realistic assessment of how your advertising is actually performing. If you ignore them, you’re just flattering yourself with an inflated ROAS, which can lead you to keep spending on a campaign that isn’t as profitable as you think. Good data attribution is the absolute foundation of measuring performance properly.
Moving Beyond a Blended ROAS
Knowing your overall Return on Ad Spend is a great starting point, but it’s a bit like looking at your business from 30,000 feet. You can see the general shape, but you’re missing the details on the ground where all the real action is happening. To make truly impactful decisions, you have to get past a blended, account-wide number and start calculating ROAS at a much more granular level.
This means breaking it down by channel, by campaign, or even by individual product. An account-wide ROAS of 4:1 might look healthy, but it could easily hide the fact that one campaign is delivering a stellar 8:1 while another is barely breaking even at 2:1. Without digging in, you’d never know where to double down or what to cut.
This flowchart lays out the fundamental path for calculating ROAS.
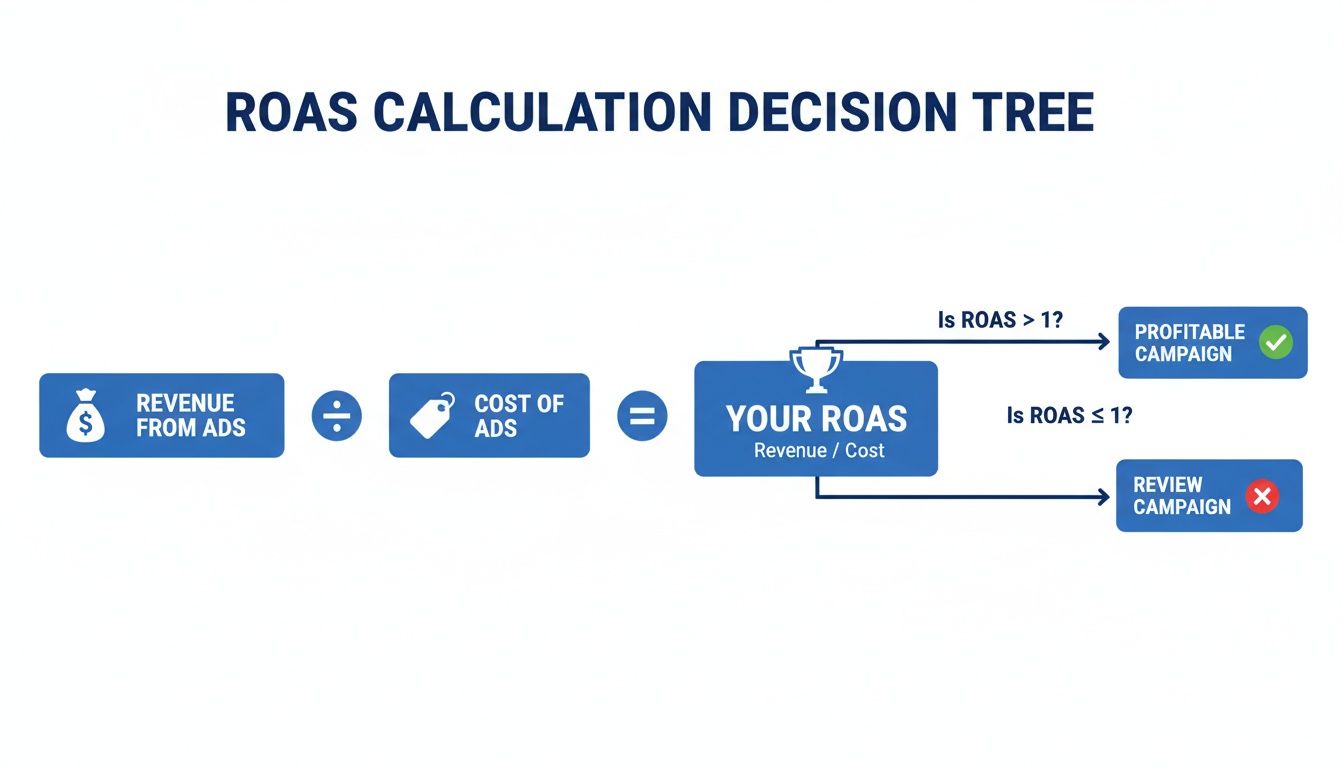
As the visual shows, at its core, the process is a simple division of the revenue your ads generated by what you paid for them. The result is your return.
Uncovering Insights with Granular ROAS
Let’s imagine a UK-based home goods store. They run ads on both Google Shopping and TikTok, and their overall blended ROAS is a respectable 3.5:1.
On the surface, everything looks fine. But when they slice the data and calculate ROAS for each channel individually, a completely different story emerges:
- Google Shopping Campaign: Spend £5,000, Revenue £22,500. ROAS = 4.5:1
- TikTok Campaign: Spend £5,000, Revenue £10,000. ROAS = 2:1
Suddenly, it’s crystal clear that Google Shopping is the workhorse, driving much higher efficiency. The TikTok campaign, while generating revenue, isn’t nearly as effective. This single insight allows the business to reallocate budget from the weaker TikTok ads to the more profitable Google Shopping campaign, instantly improving their overall return. Breaking down your advertising this way is a key first step when you want to build a full-funnel ad strategy that actually works.
Introducing Net ROAS for True Profitability
Another crucial step is to look beyond the standard calculation, which we can call Gross ROAS. Gross ROAS only considers revenue against ad spend. But what about the cost of the products you sold? This is where Net ROAS comes in, giving you a far more accurate picture of your actual profitability.
The formula for Net ROAS factors in your Cost of Goods Sold (COGS):
(Revenue from Ads – COGS) / Cost of Ads
By subtracting your COGS, Net ROAS tells you the return on your ad spend after accounting for the direct cost of producing the items sold. This shifts the focus from just revenue to actual, hard profit.
Let’s see why this distinction is so important. Consider two campaigns that both have an identical Gross ROAS of 4:1.
- Campaign A (Low-Margin Product): Spends £1,000 to sell £4,000 worth of products with a COGS of £3,000.
- Campaign B (High-Margin Product): Spends £1,000 to sell £4,000 worth of products with a COGS of £1,000.
If you only looked at Gross ROAS, you’d think both campaigns were equally successful. But calculating Net ROAS reveals the truth.
Campaign A Net ROAS: (£4,000 – £3,000) / £1,000 = 1:1 Campaign B Net ROAS: (£4,000 – £1,000) / £1,000 = 3:1
Campaign B is three times more profitable than Campaign A, despite having the same top-line performance. This is the kind of insight that separates businesses that scale profitably from those that just spin their wheels chasing revenue.
Right, you’ve got your ROAS number. So what? Is it any good?
That’s always the next question, and the honest answer is: it depends. A ROAS that would be cause for celebration at a high-margin jewellery brand could be a total disaster for a low-margin dropshipping business.
Your target ROAS is unique to your business. It’s a direct reflection of your profit margins, operating costs, and what you’re trying to achieve. As a general rule of thumb here in the UK, a 4:1 ratio—meaning you make £4 for every £1 you spend on ads—is often seen as a solid benchmark. For most e-commerce brands, that ratio is healthy enough to cover the cost of goods and other expenses, leaving a decent profit.
But context is everything. A startup gunning for market share might be perfectly happy with a lower 2:1 or 3:1 ROAS, effectively treating their ad spend as a break-even customer acquisition tool.
Finding Your Place in the Market
While your own margins are what matter most, it’s smart to look at industry and channel averages to get a feel for the landscape. Let’s be real, some platforms are just more efficient than others.
Recent UK data paints a pretty clear picture. According to the ‘Advertising Pays 2025’ report, scale plays a huge role in efficiency. On average, every £1 spent on advertising brings back £4.11 in profit for medium to large businesses. For micro-small businesses, that figure is £1.89. It shows how bigger players can often achieve better efficiency. As you map out your strategy, it’s also worth noting that online advertising isn’t slowing down, with search ads predicted to grow by 9.2% and online display by 6.7% in 2026.
How to Set Your Own ROAS Target
Instead of chasing a generic number you read in a blog post, work backwards from your own finances. It’s simple maths. If your business has a 25% profit margin, you need a ROAS of at least 4:1 just to break even on your ad spend (because 1 ÷ 0.25 = 4). Anything you make above that is pure profit.
Your ROAS target should never be set in stone. Think of it as a dynamic goal that changes with your objectives. A top-of-funnel brand awareness campaign will naturally have a much lower ROAS target than a laser-focused, bottom-of-funnel conversion campaign.
Ultimately, a “good” ROAS is simply one that helps you hit your business goals.
And don’t forget the long game. Sometimes a ROAS that looks a bit weak on the first purchase is actually incredibly profitable when you factor in the lifetime value of that customer. If they come back to buy again and again, that initial ad spend was a brilliant investment. To get a handle on this, you need to understand how to calculate customer lifetime value and build that into your targets.
Of course, hitting your target consistently means running a tight ship. A critical piece of that puzzle is optimizing landing page relevance to boost ROAS by bringing down your cost-per-click. When the right people click your ad and land on a page that perfectly matches their intent, they’re far more likely to convert—directly fuelling a healthier return.
Common ROAS Calculation Mistakes and How to Fix Them
It’s surprisingly easy to get ROAS calculations wrong, even for seasoned marketers. These aren’t just small rounding errors; they’re the kind of mistakes that lead to big, costly decisions. An inflated ROAS figure might trick you into pouring money into a campaign that’s barely breaking even, while an undervalued one could cause you to kill off a winner.
Getting this right is non-negotiable.
The Last-Click Attribution Trap
One of the most frequent errors I see is an over-reliance on last-click attribution. This model is simple, clean, and almost always wrong. It gives 100% of the credit for a sale to the very last ad a customer clicked before buying.
Think about it. That completely ignores the brand awareness video they watched last week, the social media ad they saw yesterday, and every other touchpoint that nudged them along. This flawed view consistently overvalues bottom-of-funnel channels like branded search and makes everything else look like a failure.
The Fix: It’s time to move towards a more sophisticated attribution model, like linear or time-decay. These models do a much better job of distributing credit across the entire customer journey, giving you a far more accurate picture of how all your marketing efforts actually work together.
Misinterpreting Your Time Windows
Another common pitfall is using the wrong time window for your analysis. If you’re calculating ROAS on a 7-day click window for a high-ticket item, like a bespoke sofa, you’re setting yourself up for failure. The customer journey for a purchase like that is often weeks, if not months, long.
A short window won’t capture the sales that come in later, making your campaign look like a dud when it was actually planting the seeds for future revenue.
- For quick, impulse buys: A 1-day or 7-day window might be perfectly fine.
- For considered purchases: You absolutely need to extend your window to 28 days or longer to see the true impact of your ads.
Forcing a Square Peg into a Round Hole
Finally, a critical error is trying to apply the same ROAS calculation to every single channel. This is especially true for newer formats like Digital Out-of-Home (DOOH) advertising, which just don’t play by the same rules as standard digital ads. You can’t just track clicks and direct conversions from a billboard on the London Underground.
Measuring DOOH requires a totally different approach. You have to look at metrics like localised foot traffic increases, brand lift surveys, and geo-targeted conversion analysis. This isn’t some niche channel anymore; spending in the UK is projected to hit around £930 million in 2025. You can dig into the numbers in the Statista forecast for Digital Out-of-Home Advertising in the UK. Trying to force these new formats into an old measurement box won’t just give you bad data—it will give you dangerously misleading data.
Stop Guessing: Automate Your ROAS Tracking to Make Smarter Decisions
Manually calculating ROAS across endless spreadsheets isn’t just a headache; it’s a recipe for costly mistakes and missed opportunities. We’ve all been there. As your brand grows and you start running more campaigns across different channels, the manual process quickly becomes a bottleneck. Decisions get delayed, and they’re often based on outdated information. It’s simply not sustainable.
This is where automation changes the game completely. Instead of wrestling with CSV exports and complex formulas, you can connect your entire tech stack to an intelligent platform that does the heavy lifting for you. It’s about trading hours of tedious work for instant, reliable answers.
From Cumbersome Spreadsheets to Instant Answers
Imagine having an AI-powered analyst that plugs directly into all your critical data sources. For example, a tool like Menza integrates with over 650 platforms—including your Shopify store, Google Ads account, and Meta campaigns—to automatically pull and centralise your revenue and cost data in real-time.
The real magic is how you access this information. Forget digging through dashboards or waiting for a report. You can just ask a question in plain English, like you’d ask a colleague:
‘What was our ROAS for the Black Friday campaign on Facebook?’
You get an immediate, accurate answer based on live data, without ever opening a spreadsheet. This allows you to move at the speed of your business, making adjustments based on what’s happening now, not last week. For brands trying to scale, the ability to analyse Shopify data to boost e-commerce growth becomes effortless when you don’t have to manually hunt down the numbers first.
Proactive Monitoring for Smarter Budgeting
Beyond just answering your questions, the right platform can act as a vigilant watchdog for your ad spend. It’s one thing to know how to calculate ROAS, but it’s another thing entirely to monitor it constantly to protect your budget.
This is what proactive monitoring is all about. You can set specific performance thresholds for your campaigns and get an alert the moment a key metric, like ROAS, dips below your target.
Think about these scenarios where automation gives you a massive edge:
- Sudden Performance Drop: You get an email alert that your top-performing Google Ads campaign’s ROAS has plummeted from 5:1 to 2:1 overnight.
- Budget Pacing Issues: You’re notified that a new campaign is on track to blow its monthly budget while under-delivering on its ROAS goal.
In both cases, you can jump in immediately to fix the problem before it snowballs into a significant financial loss. This fundamentally shifts your role from a reactive data wrangler to a strategic decision-maker, using trustworthy, real-time insights to drive profitable growth.
Your Top ROAS Questions, Answered
Even when you’ve got a firm handle on the formulas, real-world questions always pop up. Let’s run through some of the most common ones I hear from brands trying to apply these concepts day-to-day.
How Often Should I Be Checking ROAS?
The honest answer? It really depends on the rhythm of your business.
For a fast-moving UK e-commerce brand running daily campaigns on platforms like Meta or Google, you should be looking at ROAS daily, or weekly at the absolute minimum. This pace lets you spot issues and opportunities quickly, making small adjustments before they turn into big problems.
On the other hand, if you’re selling high-value B2B services with a much longer sales cycle, a monthly or even quarterly check-in makes more sense. The crucial thing is to be consistent and make sure your measurement window actually aligns with how long it takes a customer to go from seeing an ad to making a purchase.
Can a High ROAS Actually Be a Bad Thing?
Absolutely. A killer ROAS can definitely be misleading if you look at it in a vacuum. It’s a classic case of winning the battle but losing the war if you aren’t careful.
I’ve seen it happen: a super-niche campaign hits a fantastic 10:1 ROAS, but it only generates a handful of sales. It looks great on a report, but it’s completely useless for scaling the business. Conversely, a campaign with a lower ROAS might be driving massive volume and be far more profitable when all is said and done.
Always, always consider your profit margins. A high ROAS on a low-margin product can easily be less profitable than a moderate ROAS on a product with a healthy margin.
You have to analyse ROAS in the context of total profit, sales volume, and what you’re actually trying to achieve. That’s the only way to get the true story.
What’s the Difference Between ROAS and ROI?
It’s a great question because they’re related but measure fundamentally different things. Think of them as two different camera lenses for looking at your performance.
- ROAS (Return on Ad Spend) is a specific, tactical metric. It’s purely about measuring the gross revenue you get back for every pound you spend on advertising. It’s a marketing efficiency number.
- ROI (Return on Investment) is a much broader, strategic business metric. It looks at the total profit generated from an entire investment relative to its total cost.
ROI takes everything into account—not just ad spend, but also the cost of goods, shipping, salaries, software, the lot. In short, ROAS tells you how well your ads are working, while ROI tells you how profitable your business is overall.
Ready to stop wrestling with spreadsheets and get instant, trustworthy answers about your performance? Menza is an AI-powered data analyst that connects to your entire tech stack, delivering clear insights in plain English. Learn how Menza can automate your ROAS tracking and unlock smarter growth.
Stop guessing. Start knowing.
Menza connects to your Shopify, Klaviyo, ad platforms, and 650+ other data sources. Ask questions in plain English and get answers you can trust — no spreadsheets, no code, no waiting.