How to Calculate Customer Lifetime Value for Your UK Brand
Calculating customer lifetime value boils down to a pretty simple idea: you multiply how much a customer typically spends by how often they buy, and then you multiply that by how long you expect to keep them around. It’s a core calculation that shifts your focus from a single sale to the total revenue a customer brings over their entire relationship with your brand.
Why Customer Lifetime Value Is Your Most Important Metric

Let’s be honest, focusing only on the first sale is a short-sighted strategy. Savvy UK e-commerce brands are realising that long-term profitability isn’t built on one-off transactions. It’s built on nurturing lasting customer relationships. This is where understanding how to calculate customer lifetime value (CLV) becomes a total game-changer.
CLV gives you a lens to make smarter, more profitable decisions across your entire business. It moves you beyond simple metrics like conversion rate and helps you answer the questions that really matter:
- How much can we actually afford to spend to acquire a new customer?
- Which marketing channels bring in the most profitable customers, not just the most clicks?
- Which customers should we be rolling out the red carpet for to encourage loyalty?
Getting a real grip on CLV empowers you to dial in your customer acquisition strategy, fine-tune your marketing budget, and ultimately, build a much more resilient business.
Unifying Your Data Is the First Hurdle
One of the biggest headaches I see with growing brands is siloed data. Your Shopify store knows order history, Google Ads knows acquisition costs, and Klaviyo knows email engagement. Each platform tells you a piece of the story, but none of them gives you the full picture you need for an accurate CLV calculation.
Creating a single source of truth isn’t just a technical exercise; it’s a strategic necessity for unlocking real growth. It’s what allows you to finally connect the dots between how a customer was acquired, their purchase behaviour, and their long-term value. This is the foundation of a data-driven culture.
The push to measure CLV is gaining serious momentum. Research shows 43% of UK marketers already consider CLV implementation a high business priority, with another 57% expecting it to become one within a year.
Even so, many brands admit that fragmented data prevents them from getting an accurate number. This highlights a clear gap between strategic intent and practical execution—a challenge that modern data tools are now solving. You can dig deeper into these findings in Criteo’s report on the State of Customer Lifetime Value.
Three Practical Methods for CLV Calculation
Calculating customer lifetime value doesn’t have to be some complex, data-science-heavy exercise. It’s really about picking the right approach for where your brand is right now—your stage of growth, the data you have on hand, and what you’m trying to achieve.
Let’s walk through three solid methods, starting with the simplest and building up to the more advanced stuff. You’ll figure out which formula makes sense for you today and leave with a clear plan for measuring what your customers are actually worth.
The Classic Approach: Historical CLV
The most straightforward place to start is with the historical model. This method is exactly what it sounds like: it uses past data to add up the total revenue a customer has generated so far. It’s simple, easy to get your head around, and gives you a solid baseline, especially if you’re just dipping your toes into CLV.
This approach is retrospective, meaning it looks backward at real, hard cash you’ve already banked. While it won’t predict what a customer will do next, it’s brilliant for quickly identifying who your most valuable customers have been. You just tally up all the purchases from a customer over their entire relationship with your brand.
In the UK, the most common and practical way to calculate this for an ecommerce business is still the classic formula: CLV = Average Purchase Value × Average Purchase Frequency Rate × Average Customer Lifespan. It offers a quick yet powerful average across your entire customer base.
Let’s imagine a typical UK fashion retailer. Say the brand generated £2.4 million from 80,000 orders in a year, spread across 20,000 unique customers. From their data, they know the average customer sticks around for about 3 years. Plugging those numbers into the classic formula gives them a CLV of £360 per customer. You can see more examples of how UK brands apply this formula from these ecommerce insights.
Key takeaway: Historical CLV is your best starting point. It’s built on concrete data you already have and gives you an immediate, tangible number to anchor your marketing and retention strategies.
A More Granular View: Cohort-Based CLV
Once you’re comfortable with the basics, the next level of insight comes from cohort analysis. Instead of lumping everyone together into one big CLV number, this method groups customers into “cohorts” based on when they made their first purchase (e.g., the January 2023 cohort, the February 2023 cohort, and so on).
Calculating CLV for each cohort is where the strategic magic happens, because it reveals powerful trends over time. You can finally compare the lifetime value of customers you acquired during a big sale versus those who came from a specific marketing campaign.
For instance, you might discover things like:
- Customers acquired in November (your Black Friday promo) had a huge first purchase but almost never bought again, resulting in a low overall CLV.
- The cohort from March, which you acquired through a targeted influencer campaign, spent less at first but became incredibly loyal, leading to a much higher CLV over two years.
This kind of insight is invaluable. It tells you that while the Black Friday campaign looked great on the surface, the influencer campaign actually brought in more profitable long-term relationships. You can then adjust your marketing spend, putting more money behind the channels that deliver high-value customers, not just one-off buyers.
To do this, you’d track the cumulative average spend per customer for each monthly cohort over time. A simple spreadsheet is all you need to map this out, showing how the “Month 1,” “Month 2,” and “Month 12” value evolves for each group.
The Forward-Looking Method: Predictive CLV
While the first two methods look at the past, predictive CLV tries to forecast the future. This is the most advanced approach, using statistical models and sometimes machine learning to estimate how much revenue a customer will generate over their entire future relationship with your brand.
Predictive models dig into past purchasing behaviour, customer demographics, and even engagement signals (like email opens or website visits) to project future spending. It answers the question: “Based on what this customer has done so far, what do we think their total value will be?”
This method is a game-changer for a few reasons:
- Early identification of high-value customers: You can spot potential VIPs after just one or two purchases and start giving them the white-glove treatment to nurture that relationship.
- Proactive churn prevention: These models can flag customers whose behaviour suggests they’re about to leave, letting you jump in with a re-engagement campaign before they’re gone for good.
Now, building a predictive CLV model from scratch can be complex and often requires someone with serious data skills. But this is where modern analytics tools come in. Platforms like Menza can plug directly into your data sources—like Shopify and Google Analytics—and use your existing data to generate these forecasts automatically.
This takes care of the heavy lifting, making predictive insights accessible even if you don’t have an in-house data science team. It lets you shift from just reacting to past performance to proactively shaping future outcomes.
Choosing Your CLV Calculation Method
To help you decide which path to take, here’s a quick comparison of the three methods. Think about your goals and how much data you can comfortably work with.
| Method | Complexity | Data Required | Best For |
|---|---|---|---|
| Historical CLV | Low | Basic sales data (total revenue, orders, customers) | Getting a quick, simple baseline for your average customer value. |
| Cohort-Based CLV | Medium | Transactional data with customer acquisition dates | Understanding how customer value evolves and comparing acquisition channels. |
| Predictive CLV | High | Rich transactional and behavioural data | Forecasting future revenue, identifying high-potential customers early, and proactive churn management. |
Ultimately, the best way to calculate customer lifetime value is the one you can actually implement and use consistently. Start with the historical method to get a benchmark. As you get more confident with your data, move on to cohort analysis. From there, exploring predictive tools can unlock a whole new level of strategic foresight for your brand.
Preparing Your Data for an Accurate CLV Calculation
Your customer lifetime value calculation is only as reliable as the data you feed it. I’ve seen brands spend weeks debating complex formulas only to realise their inputs were a mess. It’s the classic “garbage in, garbage out” problem.
Think of it like baking. If you use salt instead of sugar, the result will be a disaster, no matter how perfectly you follow the recipe. Before you touch a single formula, you have to get your raw data gathered, cleaned, and organised. This is the unglamorous, foundational step where many people get stuck, but getting it right is non-negotiable.
Assembling Your Core Data Ingredients
Chances are, your customer data is scattered across several different platforms. The first job is to pull the essential pieces from each source and bring them together. You’re trying to build a single, unified story for each customer, from their first click to their most recent purchase.
Here are the critical data points you’ll need to pull:
- From your e-commerce platform (e.g., Shopify): This is your ground zero for transaction data. You’ll need customer IDs, order IDs, order dates, and the monetary value of every purchase.
- From your analytics tool (e.g., Google Analytics): This gives you the “how they found us” context. Look for the acquisition source/medium for each customer so you can eventually segment your CLV by channel.
- From your CRM or email platform (e.g., Klaviyo, HubSpot): This is a goldmine of customer-level info, especially sign-up dates, which are absolutely crucial if you want to do any kind of cohort analysis.
The whole point is to connect these different data streams using a common key—almost always the customer ID or email address. This lets you stitch everything together into one comprehensive record for each person.
This decision tree shows how the data you have on hand should guide which CLV model you choose.
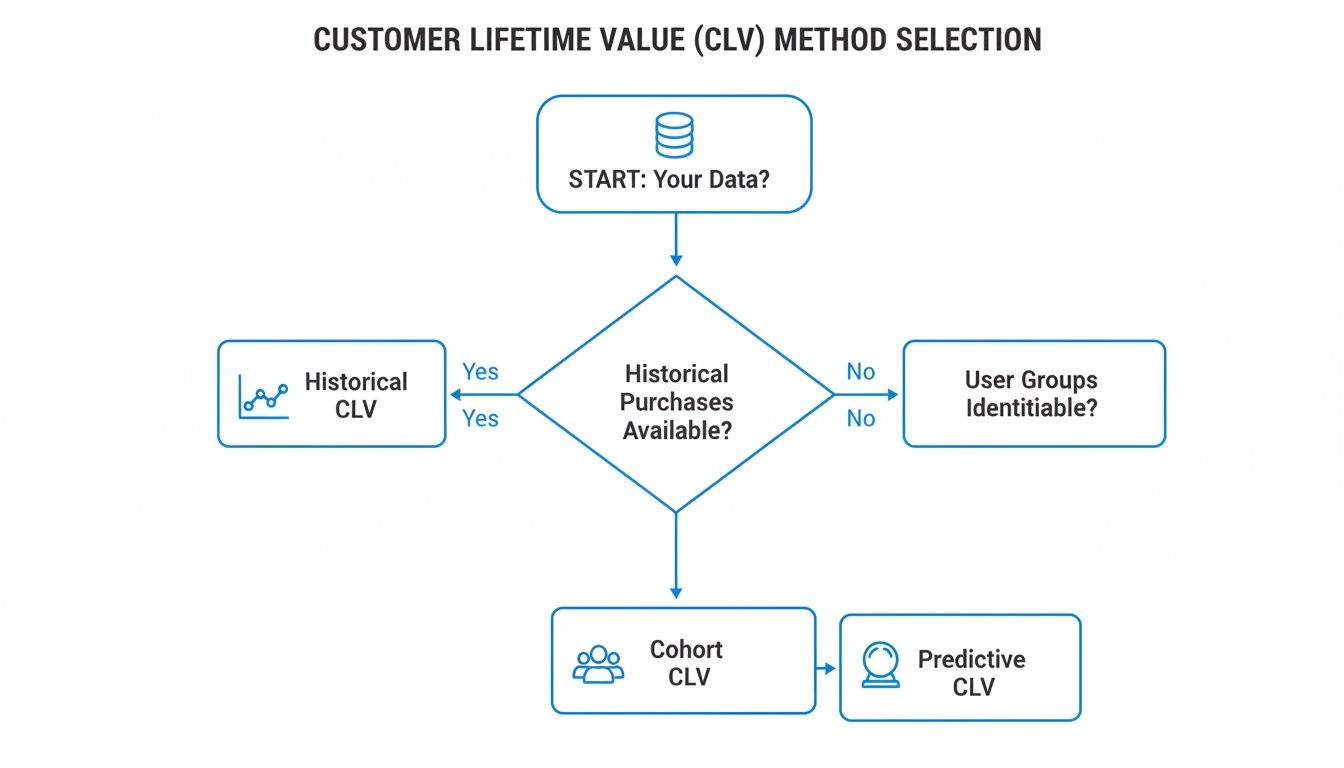
As you can see, a simple historical CLV doesn’t require much. But if you want to move into more powerful methods like cohort or predictive analysis, you need a much richer, better-organised dataset.
The Unsexy but Crucial Work of Data Cleaning
Once you’ve got all your data in one place, the real work starts. Raw data is always messy. It’s full of duplicates, typos, and weird inconsistencies that will seriously skew your results.
Taking the time to clean it up is what separates a vague guess from a metric you can confidently use to set your marketing budget.
Focus your energy on these common problems:
- Merging Duplicate Customer Profiles: It’s incredibly common for one person to have multiple profiles—maybe one from a guest checkout with a typo in their email and another from a social login. You have to find and merge these duplicates to get an accurate picture of their total spend.
- Accounting for Returns and Refunds: Your raw Shopify revenue doesn’t tell the whole story. You absolutely must subtract the value of returns and refunds from each customer’s spend. This ensures your CLV is based on net revenue, which is the only number that actually hits your bank account.
- Standardising Data Formats: This is basic data hygiene. Make sure all your dates are in the same format (like
YYYY-MM-DD), currency values are consistent, and things like country codes follow a single convention.
Cleaning data isn’t just about being accurate. It’s about building trust in your numbers. When your team knows the CLV is built on a solid foundation, they’re far more likely to actually use it to make strategic decisions.
Creating Your Single Source of Truth
With your data gathered and scrubbed, the final prep step is to create a master table—your “single source of truth.” This is a consolidated view, with one row per customer, that links their unique ID to their full transaction history, acquisition source, and key dates.
If you’re a small business, you can probably do this manually in a spreadsheet. But this approach breaks down very quickly as you scale.
This is where automated data platforms like Menza become indispensable. They connect directly to all your tools—Shopify, Google Ads, your CRM—and do the heavy lifting of pulling, cleaning, and unifying your data for you. It not only saves countless hours of data wrangling but ensures your CLV is always based on fresh, reliable information, freeing you up to focus on strategy.
Right, so you’ve calculated your CLV. That’s a massive step. But the number itself? It’s just a signpost, not the destination. The real power comes when you start using that number to make smarter calls on where you put your time, money, and energy.
This is the point where your business stops just tracking metrics and starts actively shaping its future. Translating CLV from a spreadsheet cell into actual strategy lets you fine-tune everything from your ad budget to your customer service. It gives you a clear, data-backed answer to the biggest question of all: “Where do we focus to get the best results?”
Segment Your Customers to Act with Precision
A single, company-wide CLV is interesting. A segmented CLV is where the magic really happens. Let’s be honest, not all customers are created equal. Grouping them by their lifetime value allows you to move beyond a one-size-fits-all approach and create strategies that actually work.
Start by creating some simple value tiers. You can name them whatever fits your brand, but a classic framework looks something like this:
- VIPs (Top 10-20%): These are your champions. They spend the most, buy the most often, and stick around. They’ve earned the white-glove treatment.
- Loyalists (The Next 30-40%): This is the reliable core of your business. They’re consistent repeat buyers who trust you. Keep them happy.
- At-Risk or One-Time Buyers (The Rest): These customers made a single purchase and vanished, or they’re showing signs of churning. There’s a huge opportunity here if you can re-engage them in the right way.
Once you have these segments, you can stop blasting everyone with the same generic email. Your VIPs might get early access to new products or a personal note from the founder. Your loyalists could get exclusive offers or bonus loyalty points. For the at-risk group, a well-timed “we miss you” campaign with a compelling offer might be all it takes to bring them back into the fold.
This focus on retention isn’t just a nice-to-have; it pays enormous dividends. Research has shown that a mere 5% increase in customer retention can boost a company’s profitability by up to 75%. CLV makes that impact tangible by directly connecting repeat purchases to your bottom line.
For UK brands, this is especially crucial. Loyalty programmes are baked into British shopping habits. A YouGov poll found that 77% of the UK population are members of a loyalty programme, which shows a clear appetite for rewards that recognise and encourage repeat business. You can dig deeper into these trends with additional insights on UK customer value.
Optimise Your Marketing Spend with the CLV to CAC Ratio
One of the most powerful things you can do with CLV is use it to properly judge your customer acquisition channels. For too long, marketers have been obsessed with simplistic models like last-click attribution. This often rewards channels that are great at closing a cheap sale but terrible at bringing in valuable, long-term customers.
Enter the CLV to CAC (Customer Acquisition Cost) ratio. It’s a simple but profound metric that compares what a customer is worth over their lifetime to what it cost you to get them. A healthy benchmark for many DTC businesses is a ratio of 3:1 or higher. For every pound you spend acquiring a customer, you should be getting at least three pounds back in lifetime value.
Calculating this ratio for each of your marketing channels finally gives you a true picture of profitability.
A Real-World UK Scenario
Imagine a UK-based skincare brand running ads on two different platforms:
- Platform A (e.g., a popular social media site): It costs £15 to acquire a customer (CAC). These customers are often bargain-hunters who make a couple of purchases and then disappear. Their CLV works out to be £45. The CLV:CAC ratio is 3:1 (£45 / £15). Not bad.
- Platform B (e.g., a niche content blog): The CAC is double, at £30. But these customers are far more invested in quality skincare. They become loyal fans, and their CLV is £150. The CLV:CAC ratio is a brilliant 5:1 (£150 / £30).
Without CLV, the brand might have concluded Platform A was the winner because of the lower acquisition cost. But with the full story, it’s painfully obvious that Platform B, despite the higher upfront cost, delivers far more profitable customers. Armed with this insight, the brand can confidently shift its ad spend away from the low-CLV channel and double down on the one that attracts high-value, long-term customers. That’s not just tweaking a campaign; it’s fundamentally improving the financial health of the business.
How to Automate and Visualise Your CLV Reporting
Let’s be honest. Manually exporting data, wrestling with spreadsheets, and trying to calculate customer lifetime value every month is a recipe for burnout. It’s a grind. And as your business scales, this manual approach doesn’t just get tedious; it becomes impossible.
Every hour you spend wrangling CSVs is an hour you aren’t spending on strategy and growth.
This is where automation becomes your most valuable player. The goal isn’t just to get a CLV number faster, but to make it a living, breathing metric that actively guides your business day in and day out. You need to move from a static, once-a-quarter report to dynamic, always-on insights.
Modern data tools are built to solve this exact problem. They plug directly into your entire tech stack, creating a seamless flow of information that powers your CLV calculations automatically and continuously.
Connecting Your Data Sources
The first step is integration. Instead of manually pulling reports, an automated platform connects to your key systems via APIs. This creates a single, unified data pipeline and, more importantly, eliminates the soul-crushing work of copy-pasting data into one messy master spreadsheet.
Think of the core platforms that hold your customer story:
- E-commerce Platform: Your Shopify store holds all the crucial transaction data—order values, dates, products purchased.
- Ad Platforms: Tools like Google Ads and Meta Ads tell you precisely how much it cost to acquire each customer segment.
- CRM & Email Tools: Your HubSpot or Klaviyo account provides rich context on customer relationships and communication history.
Once connected, a platform like Menza can pull this data in real-time, clean it up, and join it together. This means your CLV calculations are always based on the most up-to-date information, without you lifting a finger.
The Power of Real-Time Insights
Automation unlocks capabilities that are simply out of reach with manual methods. For instance, you can get proactive alerts sent straight to your inbox. Imagine getting an email notifying you that the CLV of customers acquired from your latest campaign is trending 15% lower than your historical average.
That kind of alert lets you investigate and pivot your strategy immediately, rather than waiting weeks for a manual report to finally tell you something went wrong.
Automation transforms CLV from a historical report card into a forward-looking guidance system. It gives you the power to spot opportunities and fix problems as they happen, not a month after the fact.
Another huge benefit is running complex analyses with a single click. Want to see a cohort analysis comparing the lifetime value of customers who used a discount code versus those who didn’t? With an automated system, that’s not a multi-day project; it’s a simple query that returns a clear answer in seconds.
Making CLV Understandable for Everyone
A number on a spreadsheet means very little to most people. The final, critical piece of the puzzle is visualisation. Turning your CLV data into simple, intuitive charts is the key to getting your entire team—from founders to marketers to product managers—to actually understand and act on these powerful insights.
Simple visualisations make complex data digestible. A line chart showing the CLV of different customer cohorts over time can instantly highlight which acquisition channels are your true champions. A bar chart comparing the CLV-to-CAC ratio across campaigns makes budget allocation decisions incredibly clear.
This visual approach democratises data. It moves the conversation out of the analytics team and into the strategic heart of the business, ensuring everyone is aligned and focused on the same goal: building long-term customer value.
Common Questions About Calculating CLV
As you start weaving Customer Lifetime Value into your business rhythm, a few practical questions are bound to pop up. Getting your head around these common queries will help you build confidence in your metrics and actually use them to make better decisions.
Here are the questions we hear most often from UK brands.
How Often Should We Calculate CLV for Our Business?
For big-picture strategic planning—like setting your annual budget or deciding on new product lines—a quarterly CLV calculation is a great pace for most UK e-commerce brands. It gives you enough data to spot real trends without getting bogged down in the daily noise.
But when it comes to performance marketing, you need a much faster feedback loop. To really see how your campaigns are performing, you should be looking at CLV monthly, or even on a rolling 28-day basis. This is how you spot whether a new audience or creative is actually bringing in valuable customers for the long term.
The best cadence is the one you can act on. Automated tools can calculate CLV in near real-time, which means you can get an alert the moment a cohort’s value starts to dip—like customers from a recent Meta campaign—and fix it before it costs you serious money.
What Is a Good CLV to CAC Ratio?
A healthy benchmark for most businesses is a CLV to CAC (Customer Acquisition Cost) ratio of 3:1 or higher. Plain and simple, this means for every pound you spend bringing a new customer in the door, you’re getting at least three pounds back over their lifetime.
It’s a powerful signal of your business’s financial health and marketing efficiency.
- Below 1:1: You’re literally paying to lose money on every new customer.
- Exactly 1:1: You’re just breaking even on acquisition, with zero margin left for any other business costs.
- A strong 3:1 ratio: This is the sweet spot. It signals you have a profitable and sustainable growth engine.
While 3:1 is a great goal, the “ideal” ratio can shift depending on your industry and business model. What’s most important is that you track your own ratio over time and understand how your marketing and operational decisions push it up or down.
How Can I Calculate CLV Without Knowing My Average Customer Lifespan?
This is the classic chicken-and-egg problem, especially for newer brands. Without years of historical data, guessing a customer’s lifespan feels like a shot in the dark. Thankfully, you’ve got a couple of solid ways to tackle this.
First, you can start with an industry benchmark. For a typical direct-to-consumer fashion brand in the UK, for example, a customer lifespan of around 2-3 years is a reasonable starting point for your first calculations. It’s not perfect, but it’s better than nothing.
A much sharper approach, though, is to calculate your customer churn rate. This is just the percentage of customers who don’t come back to make another purchase within a set period (like a year). Once you have that number, you can estimate your average customer lifespan with a simple formula: 1 / Churn Rate.
So, if you find that 25% of your customers churn each year, your average customer lifespan is 4 years (1 / 0.25). This method gives you a figure that’s actually backed by your own data, letting you calculate CLV with far more confidence, even when your brand is still young.
Stop wrestling with spreadsheets and get the answers you need to grow. Menza is an AI-powered data analyst that connects to all your tools, turning raw information into clear, decision-ready insights you can trust. Get fast, trustworthy answers from your data at menza.ai
Stop guessing. Start knowing.
Menza connects to your Shopify, Klaviyo, ad platforms, and 650+ other data sources. Ask questions in plain English and get answers you can trust — no spreadsheets, no code, no waiting.