Data Analysis for Small Business A Practical Growth Guide
Data analysis isn’t just for big corporations with teams of scientists anymore. For a small business, it’s the process of looking at the information you already have—from places like Shopify, Google Analytics, and Meta Ads—to make smarter calls on marketing, sales, and operations.
Think of it as turning the raw numbers your business spits out every day into a clear roadmap for growth. It helps you spot the profitable opportunities and, just as importantly, dodge the costly mistakes. It’s a survival tool, plain and simple.
Why Data Analysis Is Your New Competitive Edge
Let’s be real. Running a small business often feels like you’re making massive decisions based on gut feelings and a patchwork of information. You’ve probably got a spreadsheet for ad spend over here, a Shopify dashboard for sales over there, and Google Analytics open in another tab for web traffic.
Each one tells you a piece of the story, but they aren’t talking to each other. You’re left trying to navigate a maze of disconnected data.
This is exactly where a structured approach to data analysis for small business becomes your most powerful asset. It’s about moving beyond just collecting information and starting to ask the right questions—the kind that lead to real-world results.
Moving from Guesswork to Growth
If you’re running a direct-to-consumer (DTC) or e-commerce brand, the data you already own is a goldmine. It holds the answers to your most pressing questions: Which marketing channels are actually making me money? Why did sales tank last Tuesday? Are we about to sell out of our best-selling product?
Answering these questions properly requires a single, unified view of your business. Without it, you’re flying blind.
You might be pouring cash into a Meta Ads campaign that looks great on the surface but is actually bringing in low-value, one-time buyers. Or you could miss a sudden drop in your website’s conversion rate until it’s far too late. Data analysis gives you the clarity to act decisively.
The goal isn’t to become a data scientist overnight. It’s to build a reliable system that surfaces critical insights automatically, so you can focus on strategy and execution instead of wrestling with spreadsheets.
Thriving in a Competitive Market
The stakes are especially high in the UK, where small businesses are the backbone of the economy. At the start of 2023, there were 5.51 million small businesses, making up a staggering 99.9% of the private sector. These businesses employed 13.1 million people and generated 53% of all turnover.
But here’s the tough part: profitability is a massive challenge, with a median profit of just £13,000. You can find more on these findings on the state of small business Britain.
In an environment this competitive, efficiency is everything. This is where embracing data analysis truly pays off. For example, unlocking the power of AI in accounting can transform tedious financial chores into automated, error-free processes.
That’s just one way data-driven systems create a real competitive edge. They free up your time and resources, giving you the insights needed to outmanoeuvre bigger competitors and thrive.
Building Your Data Foundation from Scratch
Effective data analysis starts long before you ever look at a chart. It begins with clarity. Too many small businesses dive straight into the numbers, hoping for an epiphany, but without a solid foundation, you’re more likely to drown in information than find a real insight.
The first move is to get ruthlessly specific about what you want to achieve. A goal like ‘increase sales’ feels good, but it’s not actionable. It gives your data no direction. You need to sharpen that vague aspiration into a concrete, measurable objective.
For instance, a much more powerful goal is to ‘boost customer lifetime value by 15% in the next six months’. Or maybe it’s to ‘reduce customer acquisition cost for our flagship product by 10% this quarter’. These goals are specific, measurable, and time-bound. They give your entire data analysis process a clear purpose.
Define Your Key Business Questions
Once you have your high-level goals, the next step is to break them down into practical questions your data can actually answer. This is the bridge between your grand strategy and the decisions you have to make every single day.
For an e-commerce brand, these questions are the lifeblood of the business:
- Which marketing campaigns are actually driving the most repeat purchases, not just first-time sales?
- What’s our true return on ad spend (ROAS) after we account for product returns and refunds?
- Are we about to run out of stock on our best-selling products in the next 30 days?
- Which of our website traffic sources convert visitors into buyers at the highest rate?
These aren’t just academic exercises. These questions give your data a job to do, turning it from a passive reporting tool into an active driver of growth.
Identify and Connect Your Data Sources
With your key questions in hand, you can start hunting for the answers. For most e-commerce businesses, the data you need is scattered across a handful of essential platforms. Each one holds a critical piece of the puzzle.
A typical DTC tech stack often includes:
- Shopify (or another e-commerce platform) for all your sales, order, and customer data.
- Google Analytics for website traffic, on-site behaviour, and conversion funnels.
- Ad Platforms like Meta Ads and Google Ads for campaign performance and spend.
- Email Marketing Tools like Klaviyo for subscriber engagement and campaign results.
- Inventory Systems (or even just a spreadsheet) for stock levels and supply chain data.
Here’s the catch: these platforms don’t talk to each other by default. Looking at your Meta Ads dashboard alone won’t tell you the lifetime value of the customers those ads brought in. That golden nugget only appears when you connect your ad data from Meta with your sales data from Shopify.
A unified view of your data isn’t a luxury; it’s non-negotiable for meaningful analysis. The real magic happens when you combine disparate sources to see the full customer journey, allowing you to connect marketing spend directly to net profit.
This simple flow—collect, analyse, act—is how you build a real competitive advantage.
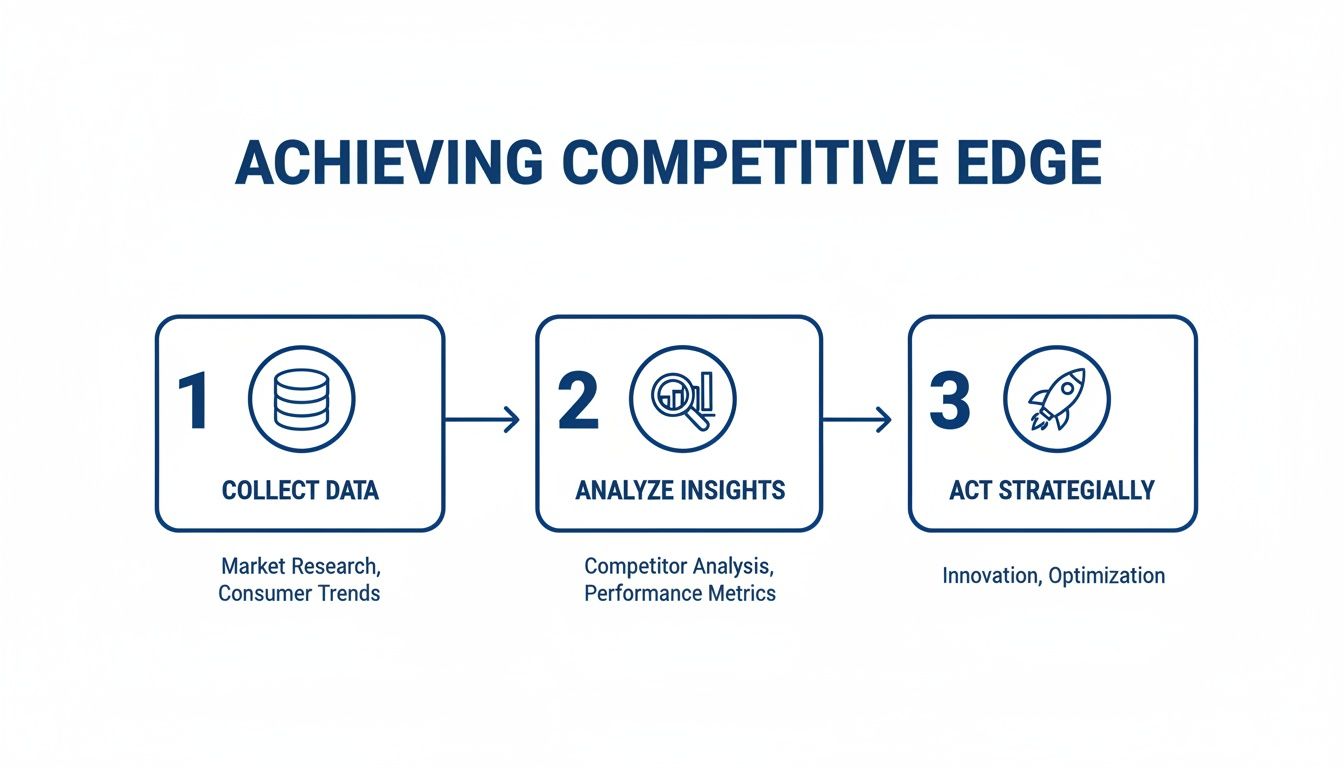
This process isn’t a one-time project. It’s a cycle of continuous improvement that separates the brands that scale from those that stagnate.
Map Your Questions to the Right Data
Now it’s time to connect the dots. This mapping exercise is where you explicitly link your business questions to the specific data sources that hold the answers. While modern data tools can automate the connections, understanding the logic behind it all is what empowers you to ask better, smarter questions.
Think of yourself as a detective. To solve a case, you need to know which evidence to collect and which witnesses to interview. It’s the exact same principle here.
Let’s run through a quick example. Your question is, “Which marketing channel has the best return on ad spend?” To answer that properly, you need to pull data from several places.
Use this table to connect your most pressing business goals with the data you need to answer them.
Mapping Your Business Questions to Data Sources
| Your Business Question | Primary Data Source | Secondary Data Source |
|---|---|---|
| Which marketing campaigns are driving the most repeat purchases? | Shopify (Order Data) | Meta Ads / Google Ads (Campaign Data) |
| What’s our true ROAS after factoring in returns? | Shopify (Sales & Refund Data) | Your Ad Platforms (Spend Data) |
| Which products are most frequently bought together? | Shopify (Order Items Data) | Google Analytics (Behaviour Flow) |
| Are we at risk of a stockout for our top-sellers? | Your Inventory System | Shopify (Sales Velocity Data) |
By combining these sources, you get a holistic view of performance that no single platform can give you. This foundational work—defining goals, identifying sources, and mapping connections—is what sets the stage for uncovering the powerful insights that will actually drive your business forward.
Choosing Metrics That Actually Drive Growth
Once your data sources are connected, the temptation is to track everything. Don’t. It’s a classic trap that leads to staring at dozens of charts, feeling overwhelmed, and rarely finding a genuine breakthrough. The real skill in data analysis for small business isn’t about measuring more; it’s about measuring what matters.
This all comes down to separating Key Performance Indicators (KPIs) from vanity metrics. A vanity metric feels good—like seeing your social media followers tick up—but it doesn’t actually connect to revenue or profit. A true KPI, on the other hand, is directly tied to the health and momentum of your company.
Ditching Vanity for Value
The first step is to be brutally honest about which numbers actually move the needle. For an e-commerce brand, that means homing in on the metrics that directly impact your bottom line across marketing, sales, and operations.
Here are a few essential KPIs that successful DTC brands live and die by:
- Customer Acquisition Cost (CAC): This is the total you spend on sales and marketing to get one new customer. Nailing this number is absolutely fundamental to profitable growth.
- Return on Ad Spend (ROAS): A direct measure of your ad efficiency. It tells you exactly how much revenue you’re generating for every pound spent.
- Conversion Rate: The percentage of people visiting your site who actually buy something. It’s a core indicator of how well your website is doing its job.
- Average Order Value (AOV): This shows how much customers typically spend in a single purchase. Pushing this number up is often a faster route to growth than just finding more customers.
Of course, to calculate these accurately, you need a crystal-clear picture of your finances. A solid guide to tracking business expenses for small businesses can be a huge help here, ensuring the ‘cost’ side of your equations is always spot-on.
Beyond the Obvious Numbers
A high conversion rate looks great on a dashboard, doesn’t it? But what if those customers never buy from you again? This is a common blind spot. Celebrating a 3% conversion rate feels good until you realise you have a dismal 10% repeat customer rate.
That’s why you need a balanced set of KPIs. You need metrics that tell the whole story, not just a single chapter.
For instance, pairing your Conversion Rate with Customer Lifetime Value (LTV) gives you a much richer, more honest picture. LTV tells you the total revenue you can expect from a customer over their entire relationship with you, shifting your focus from one-off sales to long-term value.
The most powerful insights often come from the interplay between different metrics. A great ROAS is less impressive if the customers it brings in have a low LTV. The goal is to build a dashboard of interconnected KPIs that gives you a complete health check, not just a single, misleading snapshot.
If you want to go deeper on this, we’ve put together a detailed guide on measuring acquisition costs, which even includes a handy Customer Acquisition Cost calculator.
Leading vs Lagging Indicators
To make your data truly proactive, you have to grasp the difference between leading and lagging indicators. Honestly, this concept can completely change how you run your business.
- Lagging Indicators: These are output metrics that measure past performance. Think monthly revenue or quarterly profit. They’re easy to measure, but they report on things that have already happened. You can’t directly influence them.
- Leading Indicators: These are input metrics that can predict future success. Things like website traffic from high-intent keywords, add-to-cart rate, or email subscriber growth are leading indicators. They give you a chance to influence the final outcome.
Think about it this way: a sudden drop in your add-to-cart rate (a leading indicator) is an early warning that your monthly sales (a lagging indicator) are about to take a hit.
By watching your leading indicators, your team can spot trouble on the horizon and intervene before it shows up in your end-of-month reports. This shifts your whole team’s posture from reactive firefighters to proactive problem-solvers. You start using data to prevent issues, not just explain them after the fact.
Turning Raw Data Into Actionable Insights
Right, you’ve got your goals mapped out and you know which metrics matter. Now for the fun part: finding some answers. This is the exact point where a lot of small businesses freeze up, picturing complex algorithms and assuming they need a data scientist on speed dial. The reality is much simpler, especially with the tools available today.
The goal isn’t just to look at data; it’s to have a conversation with it. Instead of staring at a static dashboard trying to connect the dots yourself, you should be able to ask a direct question and get an immediate, trustworthy answer. That’s the core of effective data analysis for small business.

From Question to Clarity: A Simple Workflow
Let’s ditch the jargon for a moment. A powerful analysis workflow boils down to a few common-sense steps, and it always starts with curiosity—a clear business question.
Imagine you run an online shop. A great starting question isn’t just “Which channel brought in the most customers?” but something more specific like: “Which marketing channel brought in our most valuable customers last quarter?” See the difference? We’re focused on value, not just volume. This is how you find profitable growth.
To get to the bottom of it, you’ll need to combine a few bits of information:
- Ad Spend Data: Pulled straight from your Meta Ads and Google Ads accounts.
- Sales & Customer Data: Sourced directly from your Shopify store.
By merging these two datasets, you can calculate your true return on investment. You might discover that while Google Ads brought in a higher volume of customers, the ones from your Meta campaign had a 30% higher average order value and a much better repeat purchase rate. Now that’s an insight you can use to reallocate your marketing budget immediately.
Spotting Issues Before They Become Disasters
A huge part of data analysis isn’t about grand discoveries; it’s about spotting anomalies—the weird dips and spikes that tell you something’s off. Your data is often the first to know when trouble is brewing, whether it’s duplicate entries skewing your reports or a sudden nosedive in a key metric.
For UK small businesses, operating on tight margins is the norm. Gross bank lending to SMEs fell to £59.2 billion in 2023, a 9% drop from the year before, pointing to a tough credit environment. With 14% of SMEs reporting losses and a median profit of just £13,000, there’s simply no room for wasted spend. Data analysis acts as your early warning system, helping you spot overspending on ad campaigns before it drains your cash reserves.
Think of it like this: your data can tell you if a new website update accidentally broke your checkout process, causing your conversion rate to plummet overnight. Catching that in hours instead of days could save you thousands.
The most valuable analysis often isn’t about discovering a revolutionary new strategy. It’s about consistently catching and fixing the small, costly problems that silently eat away at your profit margin.
The Power of Asking Deeper Questions
Once you get comfortable with the basics, you can start digging deeper to uncover the ‘why’ behind the numbers. This is where you really start to refine your strategy and pull ahead of the competition.
Moving beyond surface-level questions unlocks a whole new level of understanding:
- Instead of asking “What was our revenue last month?”, try asking “Which products contributed most to our profit margin, after factoring in shipping and returns?”
- Instead of “How many new customers did we get?”, ask “What is the lifetime value of customers acquired through our influencer campaign versus our email newsletter?”
Answering these more sophisticated questions is vital for sustainable growth. For instance, knowing your most profitable customer segments allows you to tailor your marketing messages and product development with far more precision. If you’re keen to master this, check out our in-depth guide on how to calculate customer lifetime value for a practical walkthrough.
Modern AI-powered tools are built to handle exactly these kinds of queries. They can connect to your different data sources automatically, clean up messy information, and let you ask these questions in plain English. This demystifies the entire process, empowering everyone on your team—from marketing to operations—to make smarter, data-informed decisions without needing to write a single line of code.
Making Data a Part of Your Daily Routine
A one-off report is just a snapshot in time. A truly data-driven culture, on the other hand, is a daily habit.
The whole point of doing any of this is to operationalise your insights—to weave them so deeply into your workflow that they become second nature. This final piece of the puzzle is all about shifting from occasional analysis to continuous, automated monitoring.
It’s not about adding noise or complexity to your day. It’s about creating simple, recurring reports that deliver immense value and move your business from a reactive state to a proactive one. This is a fundamental change in how you operate.

From Reactive Problem Solving to Proactive Management
Think about the old way of doing things. You only realise you’re out of stock on a bestseller when angry customer emails start flooding your inbox. Or you discover a key marketing campaign has been haemorrhaging money for weeks, but only during a stressful, end-of-month review.
Now, picture this instead. You get an automatic alert the moment a marketing campaign’s ad spend starts outpacing its conversions, letting you pause it immediately. You get a simple, automated weekly digest of your top-selling products alongside any items at risk of a stockout.
This is the shift from firefighting to forward-thinking. Instead of discovering problems after they’ve already cost you money and customer trust, you get a heads-up that lets you act before the damage is done.
Setting Up Your Automated Monitoring System
Building this kind of system doesn’t require a team of developers. Modern tools are designed to make this accessible. The trick is to start small and focus on the alerts and reports that will have the biggest impact on your bottom line.
Here are a few high-impact automations you can set up first:
-
Low-Stock Alerts: This is a game-changer for preventing lost sales. Connect your inventory system to your sales data to create a simple alert. Set a threshold, something like, “Notify me when any SKU has less than 14 days of stock remaining based on its current sales velocity.”
-
Performance Anomaly Detection: Set up monitoring for your most important KPIs. For example, create an alert that says, “Notify me if my website conversion rate drops by more than 20% compared to the previous day.” This is your early warning system for technical glitches or broken user journeys.
-
Ad Spend Pacing Alerts: To keep your marketing budget on track, you can set rules like, “Alert me if any campaign spends more than 75% of its monthly budget before the 20th of the month.” This gives you time to adjust your strategy, not just react to an overspend. You can learn more about optimising your ad spend in our guide on how to measure marketing ROI.
The purpose of automation isn’t to bombard you with notifications. It’s to create a highly curated set of signals that tells you, “Hey, this specific thing needs your attention right now.” Everything else can wait.
Creating Simple Recurring Reports
Beyond real-time alerts, scheduled reports are crucial for keeping your team aligned and focused on the right metrics. Forget dense, 20-page documents that nobody reads. The most effective reports are concise, visual, and delivered like clockwork.
This growing need for clear, accessible insights is being felt across the UK. In 2023, small businesses were increasingly seeking data-driven advice, with 23% chasing financial guidance and 21% focused on business growth. You can see more insights from the Longitudinal Small Business Survey on GOV.UK.
To make your own reporting just as effective, try these kinds of templates:
- The Weekly Marketing Snapshot: A one-page email sent every Monday morning showing total ad spend, revenue generated, ROAS, and top-performing campaigns from the previous week.
- The Daily Sales Digest: A simple summary of the previous day’s sales, AOV, and best-selling products. Quick, scannable, and powerful.
- The Monthly Operations Review: A report highlighting inventory turnover, stockout rates, and fulfilment times to help you spot operational bottlenecks before they become major problems.
By automating these essential checks and balances, you embed data into the very fabric of your business. It becomes less about ‘doing data analysis’ and more about simply running a smarter, more resilient operation every single day.
Your Data Analysis Questions Answered
Diving into your data can feel like a big step. It’s totally normal to have a bunch of questions swirling around. How much is this going to cost? Do I need to be a tech wizard? Is my data even clean enough to be useful?
These are the exact questions we hear all the time from business owners. Let’s tackle them head-on so you can move forward with confidence.
How Much Does Data Analysis Cost for a Small Business?
The answer used to be “a lot.” The traditional route of hiring a full-time analyst or licensing complex business intelligence (BI) software could easily set you back thousands of pounds every single month. For most small businesses, that’s a non-starter.
Thankfully, that’s not the only way anymore. A new wave of AI-powered platforms has emerged, built specifically with small business budgets in mind. These tools usually run on a simple subscription model that’s a fraction of the cost of a new hire.
The best part? They plug directly into the software you already use, like Shopify or Google Ads, which means you don’t need an expensive, custom-built setup. The real way to think about it is return on investment. If an affordable tool helps you prevent one costly stockout or better allocate a £10,000 ad budget, it pays for itself almost instantly. My advice is to look for solutions with transparent, predictable pricing to keep your costs under control.
Do I Need Technical Skills to Analyse My Business Data?
Not anymore. It’s true that just a few years ago, data analysis was a specialised field. You needed to know how to write SQL queries or master labyrinthine visualisation software. That barrier is gone.
The latest generation of tools is built for the rest of us. They use natural language processing, which completely changes the game. This means you can ask complex questions in plain English, just like you’d ask a colleague in Slack.
You can literally just type, “What was our customer acquisition cost for the new spring campaign compared to last year’s?” and get a direct, data-backed answer. The entire point of these tools is to democratise data, kicking the technical gatekeepers to the curb so founders and marketers can get the insights they need without learning to code.
How Do I Ensure My Customer and Business Data Is Secure?
This one is non-negotiable. When you’re connecting multiple platforms that hold sensitive business and customer information, security has to be your top priority. You absolutely must scrutinise the security credentials of any tool you consider.
Here are the key things I always look for:
- Robust Encryption: The platform must use strong, industry-standard encryption like AES-256 for both data “at rest” (stored on servers) and “in transit” (moving between your systems).
- Compliance Certifications: Look for recognised standards like SOC 2 and GDPR compliance. These aren’t just acronyms; they prove a company has undergone rigorous audits of its security and data protection protocols.
- Clear Data Policies: Reputable platforms will be completely transparent about their security architecture. They should have clear policies stating that you, and only you, retain full ownership of your data.
A trustworthy partner will never sell your information and will ensure all your credentials are fully encrypted. This gives you peace of mind that your most valuable asset—your data—is protected.
Where Do I Start If My Data Is a Mess?
This is probably the most common hurdle I see, and that feeling of being overwhelmed by messy data is completely normal. The secret is to not try and boil the ocean. You just need to start small and get a quick win.
Begin by choosing a central platform that can connect your most critical tools. Don’t even think about integrating everything at once. Your goal should be to answer one or two high-impact business questions first.
For example, a fantastic starting point for an e-commerce brand is to simply integrate your main ad platforms (like Meta and Google) with your sales system (like Shopify). This alone allows you to immediately start analysing your true marketing ROI. Once you see the value and get comfortable with the process, you can progressively add more sources, like your inventory management system or email platform. This phased approach makes the whole project manageable and builds momentum.
Ready to stop guessing and start getting clear, data-driven answers? Menza is an AI-powered data analyst that connects to your entire tech stack and answers your business questions in plain English. Get proactive alerts on stockouts, ad spend, and more—all without dashboards or code. Learn more at menza.ai
Stop guessing. Start knowing.
Menza connects to your Shopify, Klaviyo, ad platforms, and 650+ other data sources. Ask questions in plain English and get answers you can trust — no spreadsheets, no code, no waiting.